Single Cell Visualizations
Authors: Batuhan Cakir, Simon Murray and Vladimir Kiselev.
If you would like to make your single-cell RNA-seq data publicly available on a website, for example as a supplement for a publication, we can help you with that!
cellxgene
We use cellxgene to visualize single cell RNA-seq data. cellxgene is an interactive data explorer which is very scalable and flexible.
To be able for us to create a cellxgene website for your data we need to have your data in the h5ad (AnnData) format.
AnnData
AnnData format usually contains the following slots:
X contains the expression matrix.
obsm contains the embeddings data.
obs contains the cell metadata.
var contains the gene metadata.

When you work with cellxgene you only need to modify two of the slots above: obsm and obs.
X slot
The X slot should contain a normalised expression matrix. Raw counts can still be loaded into cellxgene, but they are not recommended for visualization: gene search and gene colouring will use the raw count values directly, so the colour scale and value range can look skewed or difficult to interpret.
It is recommended to store the expression matrix in CSR (compressed sparse row) format to create smaller files depending on sparsity of your data instead of CSC (compressed sparse column) format or dense Numpy array.
To convert your expression matrix into the CSR format please use:
adata.X = scipy.sparse.csr_matrix(adata.X)
To convert your expression matrix into the Numpy array please use:
adata.X = scipy.sparse.csr_matrix.toarray(adata.X)
obsm slot
To visualize your cells in 2D cellxgene uses obsm slot. If there are multiple embeddings stored in this slot they will all be available on the web interface.
Note
cellxgene requires that all of the embeddings’ names are prefixed with X_. For example, X_umap, X_pca or X_some_embedding.
obs slot
To highlight and colour your cells cellxgene uses obs slot. The colouring will depend on the type of you cell metadata contained in the obs slot.
When the metadata is categorical, i.e. there is one colour per category, the visualization will look like this:
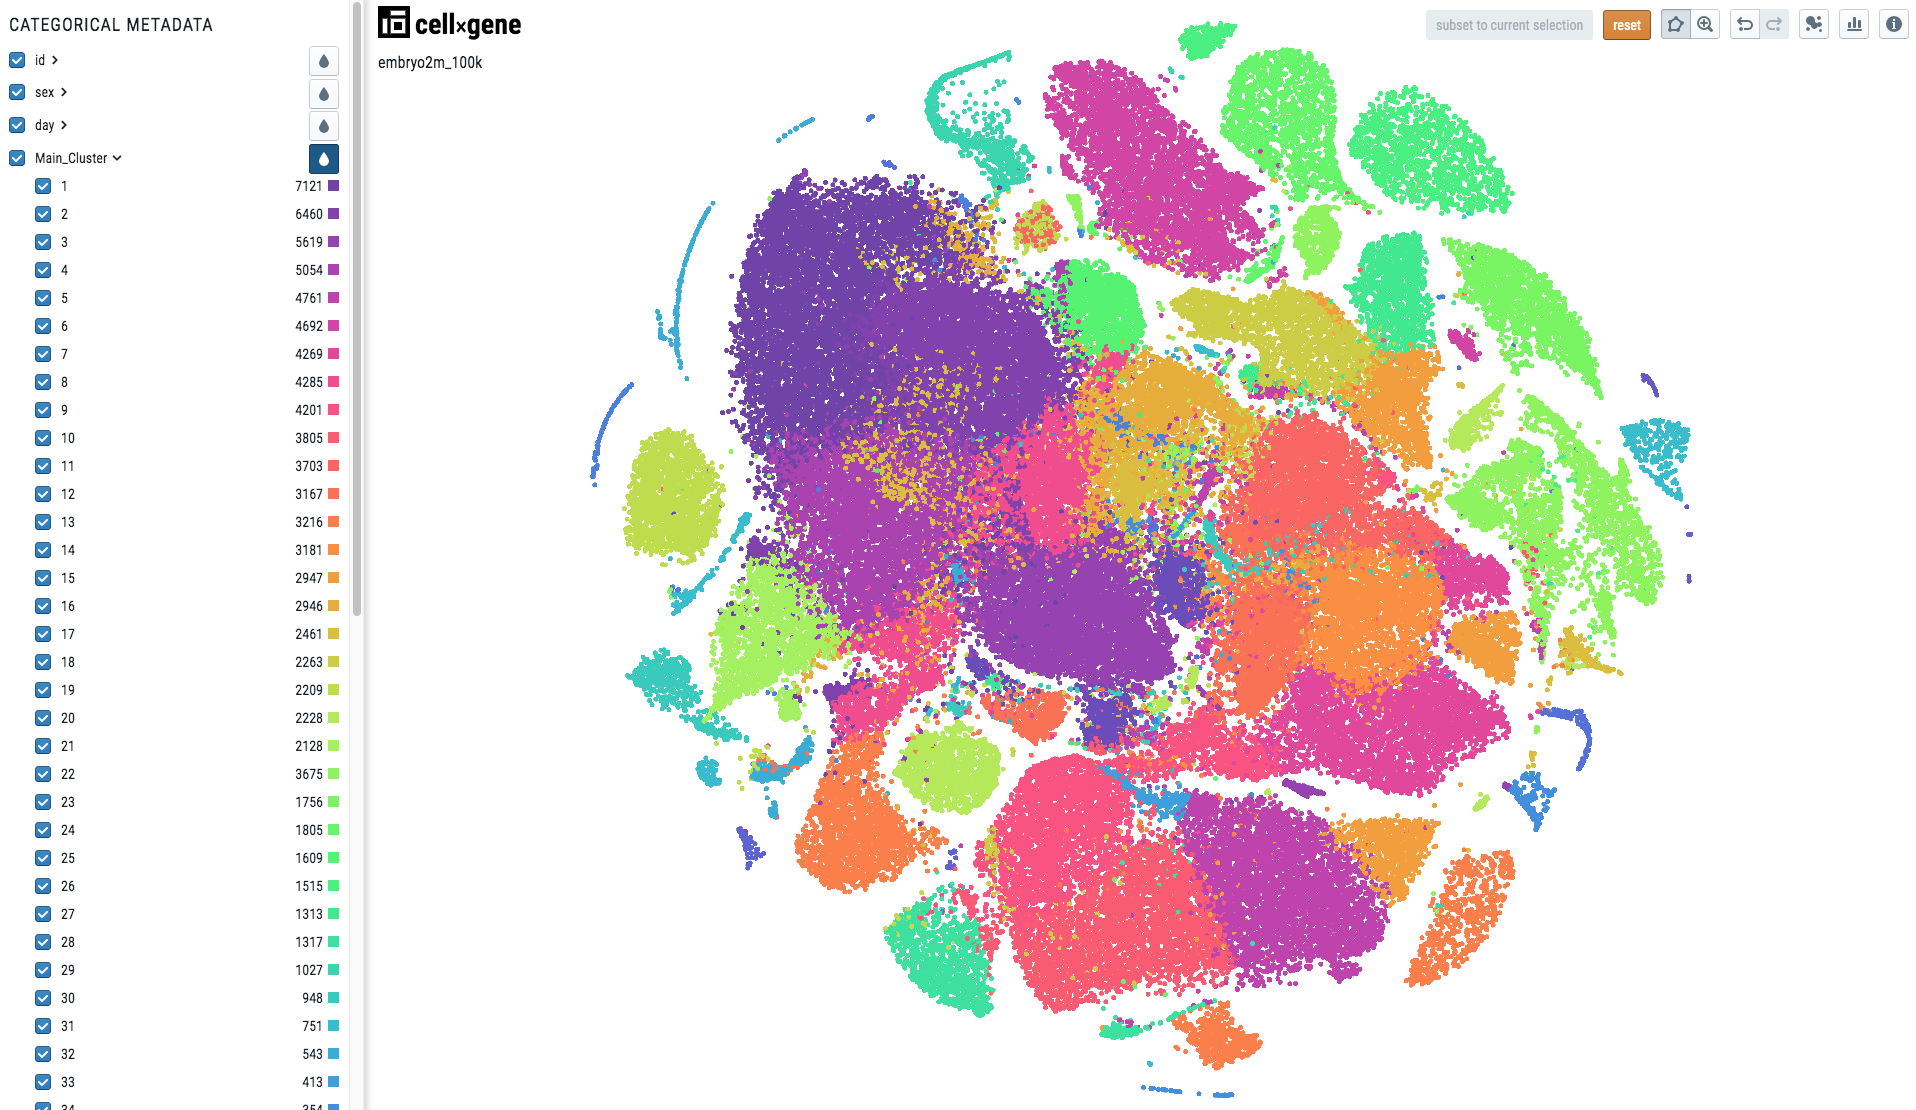
To make your cell metadata categorical please use the following code:
import pandas as pd
adata.obs['metadata_name'] = pd.Categorical(adata.obs['metadata_name'])
When the metadata is continuous, the visualization will look like this:
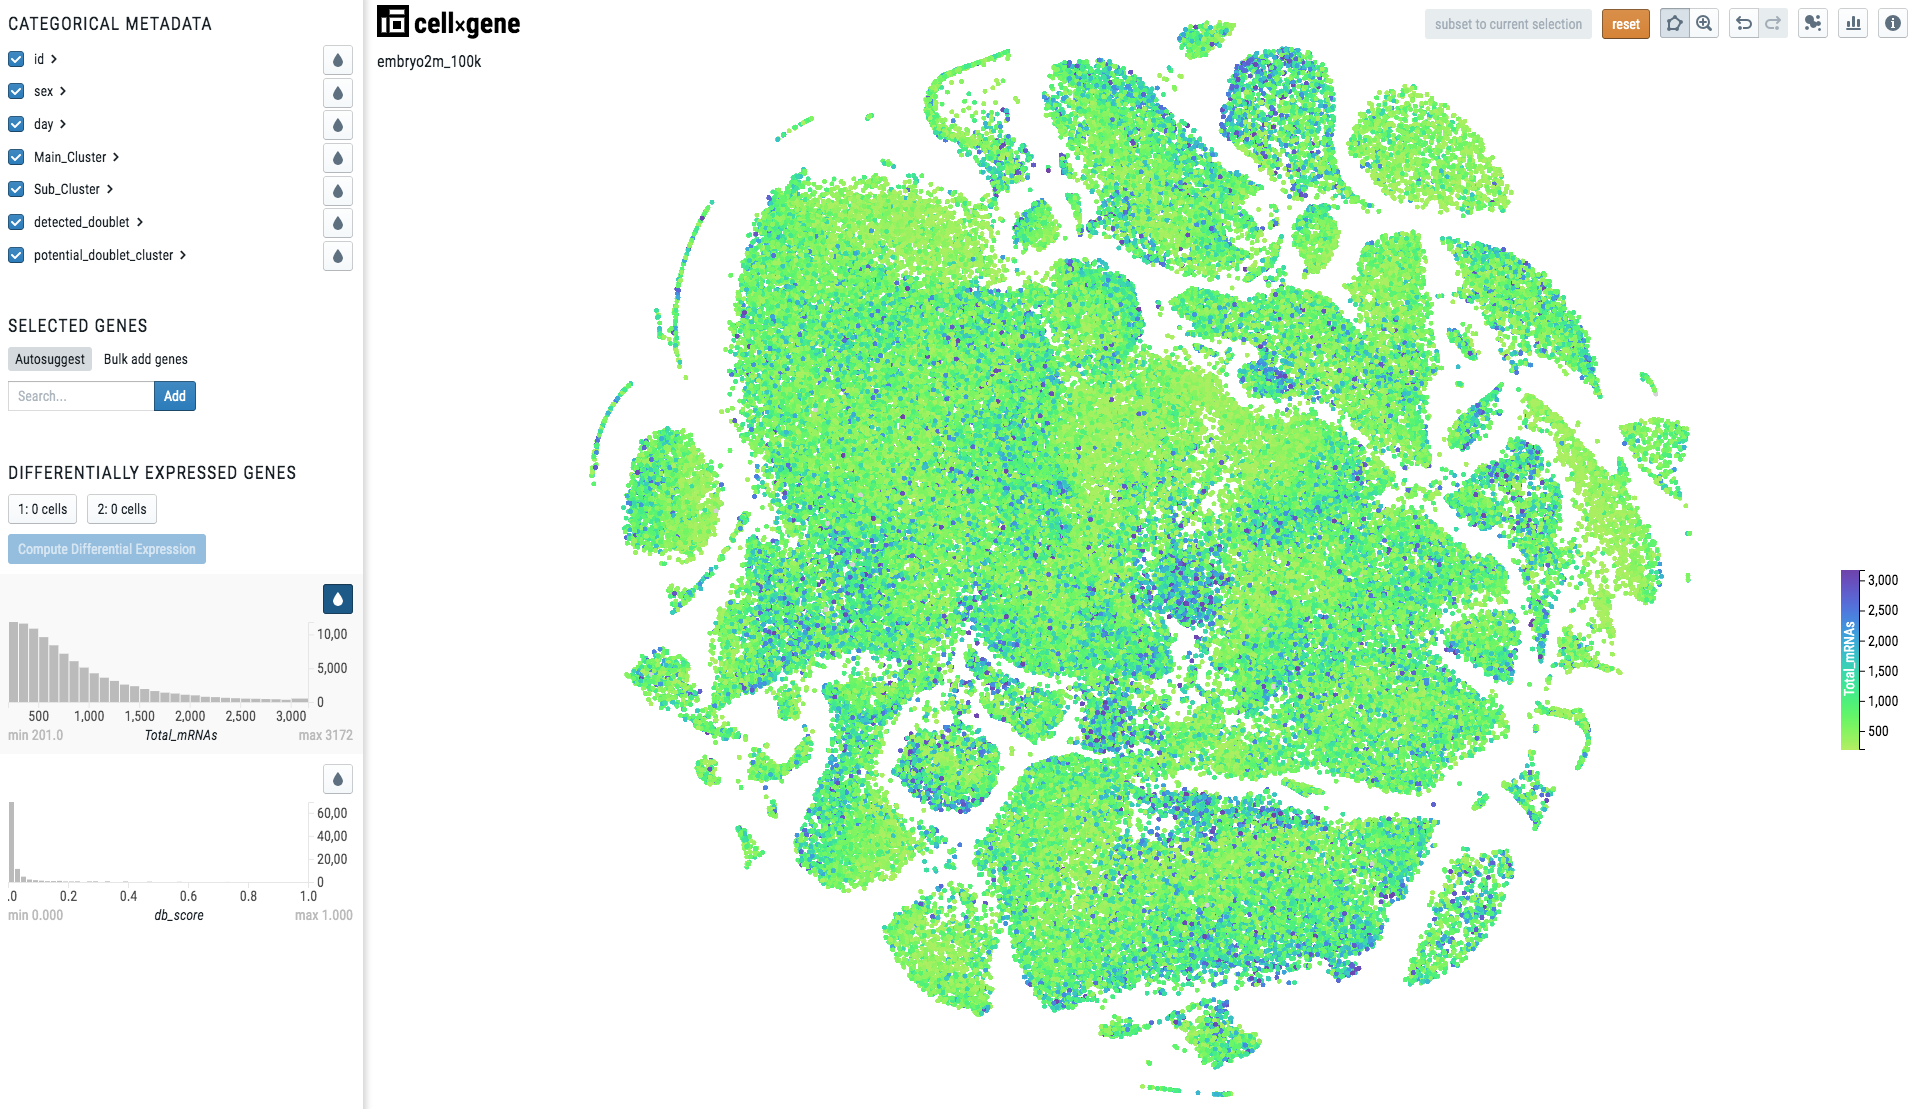
Note
Note there is a continuous scale on the right side of the plot.
To make your cell metadata continuous please use the following code:
import numpy as np
adata.obs['metadata_name'] = np.float32(adata.obs['metadata_name'])
Optimizations
CELLxGENE visualizations usually don’t need all the same raw data as your prepared count matrices. To make an optimize object for CELLxGENE we recommend you: remove unncesary observations, make sure your continuous data is 32bit and not 64bit, remove any var that is not the anndata index, and remove all raw and additional layers data.
import scanpy as sc
adata = scanpy.read(filename)

# cast float64 to float32
for c in list(adata.obs.select_dtypes(include='float64')):
    adata.obs[c] = adata.obs[c].astype('float32')

# cast int64 to int32
for c in list(adata.obs.select_dtypes(include='int64')):
    adata.obs[c] = adata.obs[c].astype('int32')

# remove additional var columns
adata.var = adata.var.drop(adata.var.columns, axis='columns')

# fix colors — if you've used #RRGGBBAA instead of #RRGGBB this will fix that
for color_annotation in [k for k in  adata.uns.keys() if k.endswith("_colors")]:
    try:
        adata.uns[color_annotation] = [color[:7] for color in adata.uns[color_annotation]]
    except:
        pass

# remove raw and layers
del adata.raw
del adata.layers

# write out a new 'filename.cellxgene.h5ad'
adata.write(filename.replace(".h5ad",".cellxgene.h5ad"))
Visium data
If your want to use cellxgene with Visium data, you need to follow these steps:
You can use scanpy.read_visium function to read from Space Ranger output folder and it will import everything needed to AnnData. Be careful that the images should contain one sample only. If not, you need to crop the other samples out.
The spatial embedding layer should be contained in obsm and be named X_spatial. Other layers can exist, but only this one will have the spatial feature enabled.
adata.obsm['X_spatial'] = adata.obsm['spatial']
del adata.obsm['spatial']
If you already have h5ad file before importing Visium and add spatial features from the Visium data that, you should transfer the same slots from the h5ad file created after you imported Visium data.
# adata is the original one, adata2 is the AnnData you imported to Python via `scanpy.read_visium`

adata.uns['spatial'] = adata2.uns['spatial']
adata.obsm['X_spatial'] = adata2.obsm['X_spatial']
Cell metadata (e.g. clustering) should be imported manually. You should use pandas.read_csv to add them, and change their type with .astype("category") if not continuous:
adata.obs['clustering_x'] = pandas.read_csv('clustering_x.csv', index_col = 'Barcode')
adata.obs['clustering_x'] = adata.obs['clustering_x'].astype("category")
If you want to integrate your Cell2Location output to your h5ad file, you should add the cell abundance tables from csv or obsm slot to obs slot to be able to color your cells by cell abundances. If you have csv files, you have to import csv to h5ad.
# if your cell abundance data are in csv files
cell_abundance = pd.read_csv('/your/path/to/csv')
adata.obs = pd.concat([adata.obs, cell_abundance], axis=1)
adata.obsm['q05_cell_abundance_w_sf'] = pd.read_csv('/your/path/to/csv')

# if your cell abundance data are in obsm slot
adata.obs = pd.concat([adata.obs, adata.obsm['q05_cell_abundance_w_sf']], axis=1)
If you have cell abundance table in another h5ad, you can transfer it to main h5ad file:
adata.obs = pd.concat([adata.obs, adata2.obsm['q05_cell_abundance_w_sf']], axis=1)
You can check and download the notebook to make your Visium data compatible with cellxgene from Google Colab: https://colab.research.google.com/github/cellgeni/docs/blob/master/docs/source/visium_to_cxg.ipynb
Data Conversion
We have released the sceasy package on GitHub (https://github.com/cellgeni/sceasy) to easily convert other single-cell file types to AnnData format for visualization with cellxgene. Currently it supports converting Seurat, SingleCellExperiment and Loom objects to AnnData. By default it transfers expression matrices, cell and gene metadata table, and, if available, cell embeddings in reduced dimensions to AnnData.
Warning
Before installing the conda packages below please first create a new conda environment EnvironmentName and activate it. Everything else can be installed in R.
sceasy is installable either as a bioconda package:
conda install -c bioconda r-sceasy
or as an R package:
devtools::install_github("cellgeni/sceasy")
To use sceasy ensure the anndata package (version has to be < 0.6.20) is installed:
conda install anndata == 0.6.19 -c bioconda
In addition, please also ensure the loompy package (loompy version < 3.0.0) is installed:
conda install loompy == 2.0.17 -c bioconda
You will also need to install reticulate package:
install.packages('reticulate')
Finally, before converting your data please load the following libraries in your R session:
library(sceasy)
library(reticulate)
use_condaenv('EnvironmentName')
loompy <- reticulate::import('loompy')
Seurat to AnnData
sceasy:::convertFormat(seurat_object, from="seurat", to="anndata",
                       outFile='filename.h5ad')
Seurat to SingleCellExperiment
sceasy:::convertFormat(seurat_object, from="seurat", to="sce",
                       outFile='filename.rds')
SingleCellExperiment to AnnData
sceasy:::convertFormat(sce_object, from="sce", to="anndata",
                       outFile='filename.h5ad')
SingleCellExperiment to Loom
sceasy:::convertFormat(sce_object, from="sce", to="loom",
                       outFile='filename.loom')
Loom to AnnData
sceasy:::convertFormat('filename.loom', from="loom", to="anndata",
                       outFile='filename.h5ad')
Loom to SingleCellExperiment
sceasy:::convertFormat('filename.loom', from="loom", to="sce",
                       outFile='filename.rds')
Examples
We have already created a couple of websites for some of our programme members. You can have a look at them at the following links: