Single Cell Visualizations
Authors: Batuhan Cakir and Vladimir Kiselev
If you would like to make your single-cell RNA-seq data publicly available on a website, for example as a supplement for a publication, we can help you with that!
cellxgene
We use cellxgene to visualize single cell RNA-seq data. cellxgene is an interactive data explorer which is very scalable and flexible.
To be able for us to create a cellxgene website for your data we need to have your data in the h5ad (AnnData) format.
AnnData
AnnData format usually contains the following slots:
- X contains the expression matrix.
- obsm contains the embeddings data.
- obs contains the cell metadata.
- var contains the gene metadata.

When you work with cellxgene you only need to modify two of the slots above: obsm and obs.
X slot
cellxgene works faster when the expression matrix is stored in CSC (compressed sparse column) format instead of CSR (compressed sparse row) format or dense Numpy array (which sometimes can create a smaller h5ad file depending on the sparsity of your data).
To convert your expression matrix into the CSC format please use:
adata.X = scipy.sparse.csc_matrix(adata.X)
To convert your expression matrix into the Numpy array please use:
adata.X = scipy.sparse.csc_matrix.toarray(adata.X)
obsm slot
To visualize your cells in 2D cellxgene uses obsm slot. If there are multiple embeddings stored in this slot they will all be available on the web interface.
Note
cellxgene requires that all of the embeddings’ names are prefixed with X_. For example, X_umap, X_pca or X_some_embedding.
obs slot
To highlight and colour your cells cellxgene uses obs slot. The colouring will depend on the type of you cell metadata contained in the obs slot.
When the metadata is categorical, i.e. there is one colour per category, the visualization will look like this:
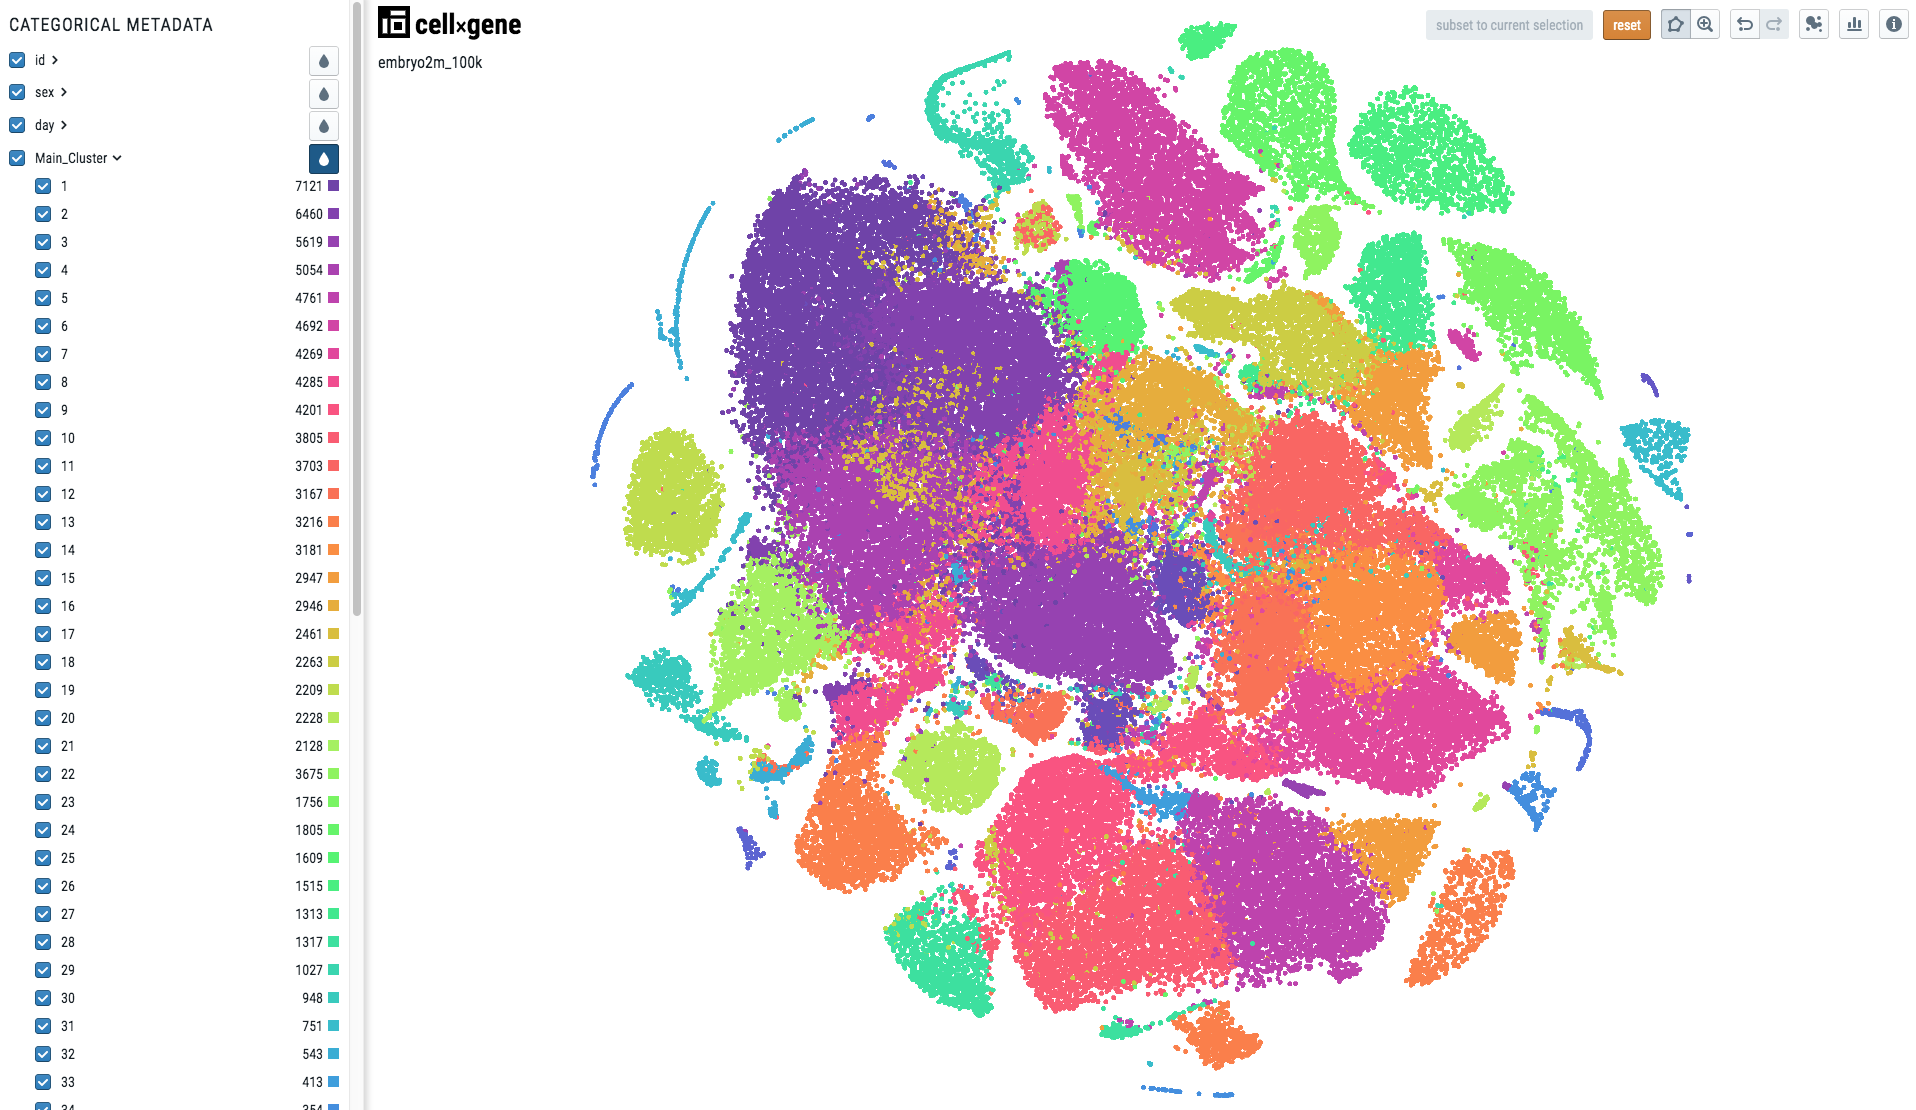
To make your cell metadata categorical please use the following code:
import pandas as pd
adata.obs['metadata_name'] = pd.Categorical(adata.obs['metadata_name'])
When the metadata is continuous, the visualization will look like this:
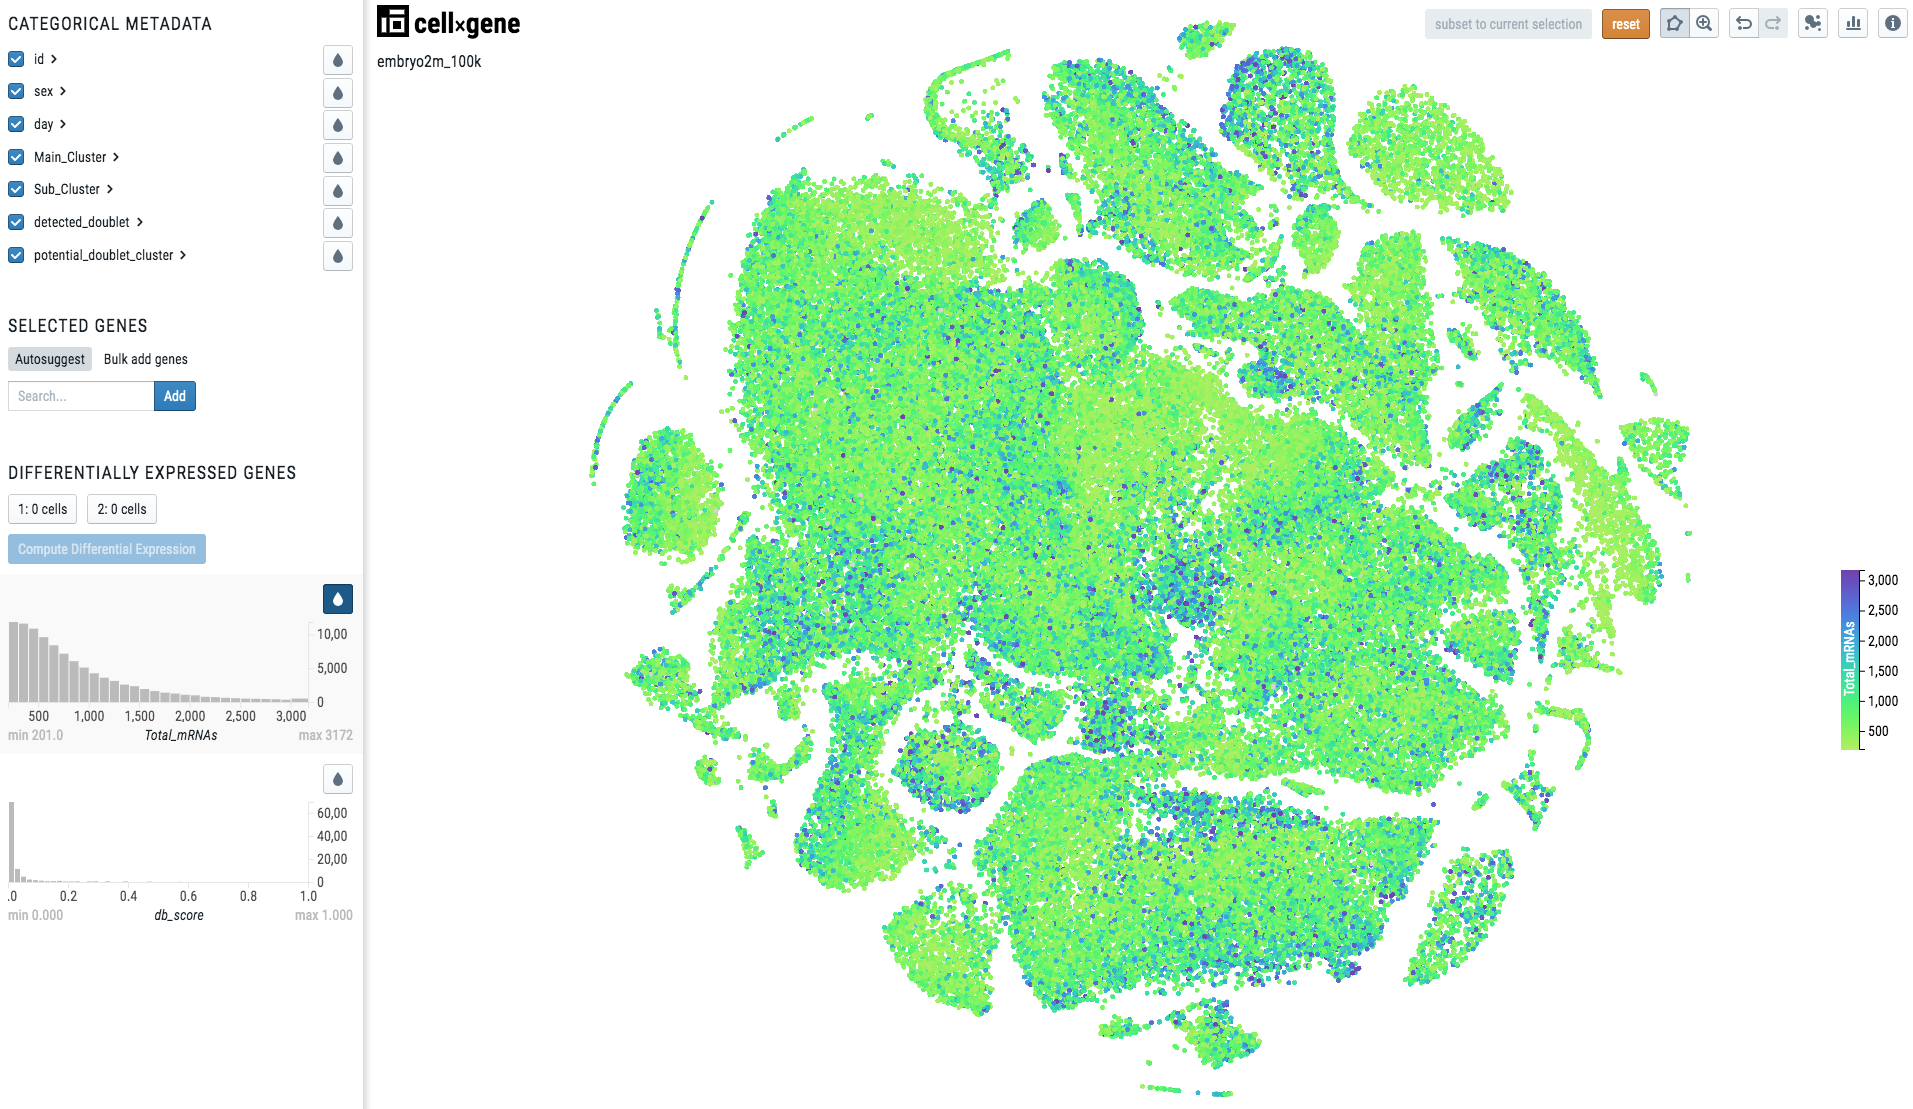
Note
Note there is a continuous scale on the right side of the plot.
To make your cell metadata continuous please use the following code:
import numpy as np
adata.obs['metadata_name'] = np.float32(adata.obs['metadata_name'])
Warning
Before converting your data to h5ad format please make sure anndata library is installed on your system. Use the either of the following commands to install it: pip install anndata or conda install anndata -c bioconda.
Seurat -> h5ad
To convert a Seurat object seurat_object to h5ad format, you can use the reticulate package:
library(reticulate)
anndata <- import("anndata", convert = FALSE)
adata <- anndata$AnnData(
    X = t(GetAssayData(object = seurat_object)),
    obs = data.frame(seurat_object@meta.data),
    obsm  = list(
        "X_emb1" = Embeddings(seurat_object[["emb1"]]),
        "X_emb2" = Embeddings(seurat_object[["emb2"]])
    )
)
anndata$AnnData$write(adata, 'filename.h5ad')
SingleCellExperiment -> h5ad
To convert a SingleCellExperiment object sce_object to h5ad format, you can use the reticulate package:
library(reticulate)
anndata <- import("anndata", convert = FALSE)
adata <- anndata$AnnData(
    X = t(counts(sce_object)),
    obs = data.frame(colData(sce_object)),
    obsm  = list(
        "X_emb1" = as.matrix(reducedDim(sce_object, "emb1")),
        "X_emb2" = as.matrix(reducedDim(sce_object, "emb2"))
    )
)
anndata$AnnData$write(adata, 'filename.h5ad')
Loom -> h5ad
To convert a loom file to h5ad format, you can use the following code (here we use an example dataset from Linnarson Lab which can be downloaded using this link):
import loompy
import scanpy as sc
import pandas
import numpy
import scipy

adata = sc.read_loom('L6_Immune_cells.loom')

# Move embeddings info to the right place and right format
x = pandas.Series.to_numpy(adata.obs['_X'])
y = pandas.Series.to_numpy(adata.obs['_Y'])
xy = numpy.stack((x,y)).transpose().reshape(-1,2)
adata.obsm['X_test'] = xy

# Only include necessary metadata:
adata.obs['Clusters'] = pandas.Categorical(adata.obs['Clusters'])
adata.obs = adata.obs[{'Clusters','Age','Sex'}]

# Change the matrix format
adata.X = scipy.sparse.csc_matrix(adata.X)

# Make variable and observation names unique
adata.var_names_make_unique()
adata.obs_names_make_unique()

# Write h5ad file
adata.write('filename.h5ad')
Examples
We have already created a couple of websites for some our programme members. You can have a look at them at the following links: